Paper! (with an SVG gauge from QS)
Just found out that I was named as a co-author on a new paper, published in the online journal Cureus in January:
A Web-based Decision Tool to Estimate Subarachnoid Hemorrhage Risk in Emergency Department Patients
This “web-based decision tool” was an online calculator that I built to the specifications of Dr. Prasanthi Govindarajan of Stanford University. The idea was to build a gauge (visually, something like an old-fashioned steam gauge) to assess a patient’s risk of brain hemorrhage and the advisability of certain additional medical tests. The risk of hemorrhage was to be given on an inverse logarithmic scale. To make it more fun and challenging, the risk zones (colored green, yellow and red, per convention) had to slide to different sections of the gauge’s rim, with various widths, depending on the patient’s specific risk factors.
The calculations are carried out in Javascript. To display the gauge, I checked out a number of libraries and plug-ins built for the purpose, but wasn’t sure any of them could give me a reverse logarithmic scale as well as fine-grained dynamic control over the reference colors. Also, I wanted to be sure the thing would look good. In the end I decided to bite the bullet and learn SVG (not bad!) and code it myself.
Here’s a screen shot of the calculator:
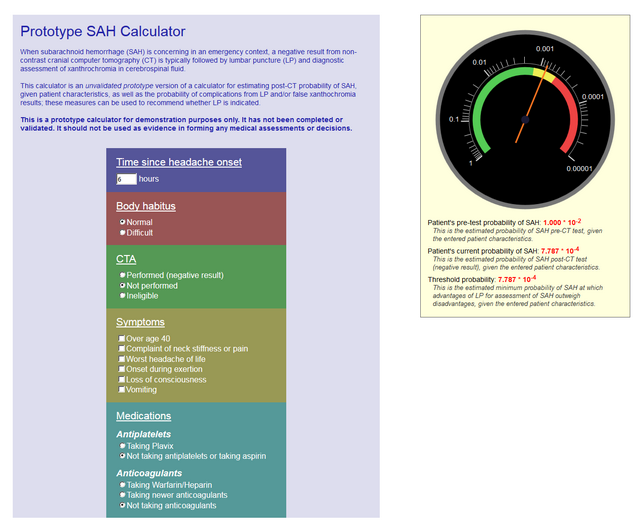
But really, you’ve got to play with the thing yourself to see it in motion.
Thanks to Prasha for seeing that I was named on the paper. Developers aren’t always included as authors on scientific papers – probably because publications aren’t make-or-break for our careers, as they can be for clinical researchers. Still – it’s nice to be acknowledged. I really enjoyed this project. Hoping that they get a grant to take the prototype further.
Leave a Reply